 |
MODFLOW 6
version 6.8.0.dev0
USGS Modular Hydrologic Model
|
|
MODFLOW 6
version 6.8.0.dev0
USGS Modular Hydrologic Model
|
Data Types | |
| type | measuredsectiontype |
| type | profilertype |
| A public type for profiling performance in the application. The ProfilerType is used to measure and record the performance of various parts of the application. It provides mechanisms to start, stop, and. More... | |
Functions/Subroutines | |
| subroutine | pre_init (this) |
| subroutine | initialize (this) |
| integer(i4b) function | add_section (this, title, parent_id) |
| Add a new timed section to the tree, passing the parent id will add it as a child. More... | |
| subroutine | start (this, title, section_id) |
| Start section timing, add when not exist yet (i.e. when id < 1) More... | |
| subroutine | stop (this, section_id) |
| subroutine | print (this, output_unit) |
| recursive subroutine | print_section (this, section_id, level) |
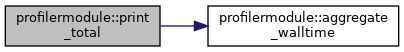
| subroutine | print_total (this, subtitle) |
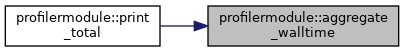
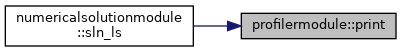
| real(dp) function | aggregate_walltime (this, title) |
| Aggregate walltime over sections with a certain title. More... | |
| integer(i4b) function | aggregate_counts (this, title) |
| Aggregate counts over sections with a certain title. More... | |
| subroutine | set_print_option (this, profile_option) |
| Set the profile option from the user input. More... | |
| subroutine | destroy (this) |
| Clean up the CPU timer object. More... | |
| integer(i4b) function | largest_title_length (this) |
| Calculate the largest title length. More... | |
| subroutine | sort_by_walltime (this, idxs) |
| Sort section indexes based on walltime. More... | |
Variables | |
| integer(i4b), parameter | max_sections_per_sln = 40 |
| integer(i4b), parameter, public | len_section_title = 128 |
| type(profilertype), public | g_prof |
| the global timer object (to reduce trivial lines of code) More... | |
|
private |
Definition at line 140 of file Profiler.f90.
|
private |
Definition at line 366 of file Profiler.f90.
|
private |
|
private |
Definition at line 403 of file Profiler.f90.
|
private |
|
private |
Definition at line 420 of file Profiler.f90.
|
private |
Definition at line 75 of file Profiler.f90.
|
private |
|
private |
Definition at line 277 of file Profiler.f90.
| subroutine profilermodule::print_total | ( | class(profilertype) | this, |
| character(len=*) | subtitle | ||
| ) |
|
private |
Definition at line 384 of file Profiler.f90.
|
private |
| subroutine profilermodule::start | ( | class(profilertype) | this, |
| character(len=*) | title, | ||
| integer(i4b) | section_id | ||
| ) |
Definition at line 176 of file Profiler.f90.
|
private |
Definition at line 206 of file Profiler.f90.
| type(profilertype), public profilermodule::g_prof |
Definition at line 70 of file Profiler.f90.
| integer(i4b), parameter, public profilermodule::len_section_title = 128 |
Definition at line 15 of file Profiler.f90.
|
private |
Definition at line 14 of file Profiler.f90.